Posts

Showing posts with the label Candle Stick Patterns

Candle Stick Body

Image
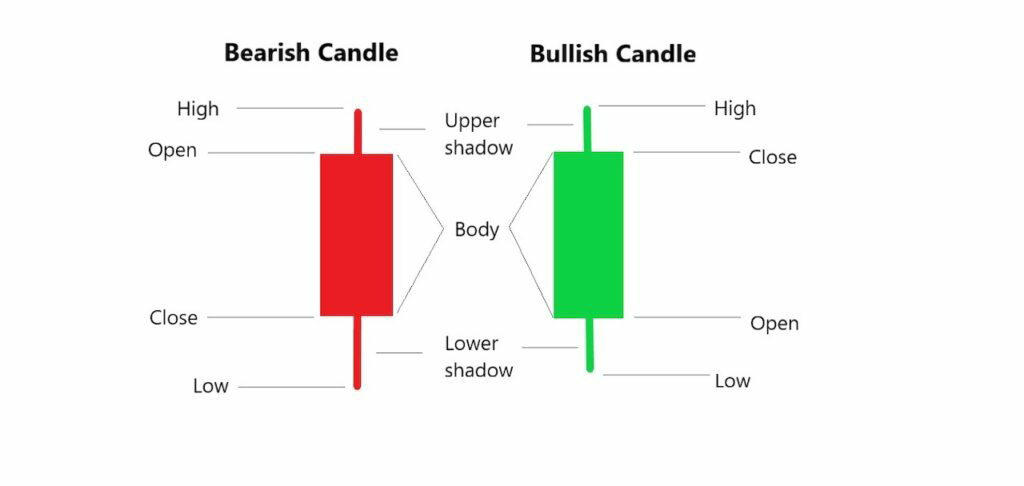
In a candlestick chart, the opening price is represented by the top or bottom of the body (rectangle or oval shape) and the closing price is represented by the opposite end. If the closing price is higher than the opening price, the body is typically depicted as hollow (white or green), indicating a bullish trend, or an upward price movement. If the closing price is lower than the opening price, the body is typically depicted as filled (black or red), indicating a bearish trend, or a downward price movement. The difference between the opening and closing price is shown by the height of the body, with longer bodies indicating greater price movement and greater market sentiment. Candle Stick Bodies are the core element of a chart in technical analysis. They are used to analyze price action and depict the difference between the opening and closing pricess for a given period of time. Candlestick bodies represent the difference between buyers and sellers, and often tell traders

Spinning Tops

Image
Spinning tops are a type of candlestick pattern that helps traders identify potential reversals in the market. The spinning top is a single-day formation consisting of an open, high, low, and close that are all near each other but not necessarily equal. These patterns represent indecision in which neither buyers nor sellers can gain control. Spinning tops have small real bodies and often have upper and lower shadows of approximately the same length. A spinning top could also be described as a candle with little or no real body and long wicks at both ends. The interpretation of this formation is that neither buyers nor sellers could take control during the trading session, resulting in little or no change in price from the open to the close. This suggests that buying pressure has lessened and selling pressure has increased or vice versa. Spinning tops warn traders that the current trend may be coming to an end; if the current trend continues, then it will likely break out so

Doji

Image
A Doji is a type of candlestick pattern that occurs in the financial markets, and is used by traders to identify potential reversals in price. It is composed of a single candle stick with an open and a close that are at or very close to the same price. In some cases, the open and close may even be the exact same price. The appearance of a doji on a chart indicates that buyers and sellers have reached an equilibrium – neither side was able to gain control over the other. This can signal either that momentum in the market is slowing down, or that there could be a potential reversal in trend coming up soon. The most common type of doji is known as a "long-legged doji". This type of pattern has extended upper and lower shadows which indicate high levels of volatility during the period when it formed – this means that prices moved significantly higher or lower during the session but closed near where it opened. Additionally, this high level of volatility could mean tha

Evening Star

Image
The Evening Star is a popular and commonly used candlestick pattern. It is a three-day chart formation that signals the reversal of an uptrend. This pattern consists of three candlesticks: a large green body (day one) followed by a short-bodied candle with a gap up from the first day (day two), and finally a red candle that closes below the midpoint of the first day's body (day three). Traders typically interpret this pattern as an indication that buyers have exhausted their buying power, allowing sellers to take control of prices at the start of day two. The significance of this formation lies in its potential to signal bearish price action for days to come. The Evening Star pattern can be seen as early warning that an uptrend may be coming to an end, giving savvy traders time to prepare for any changes in direction ahead. It is not necessarily indicative of an imminent downturn in price but rather suggests the possibility of one. As such, traders should look for confi

Bearish Engulfing

Image
Engulfing A Bearish Engulfing pattern is a two-candlestick reversal pattern seen in technical analysis. It typically occurs at the top of an uptrend and indicates a shift in momentum from buyers to sellers. The first candlestick is a white or green candle that reflects an upward move, while the second candlestick is a black or red candle that closes lower than the previous day's open – engulfing the previous day's body. This pattern often signals that a downtrend will follow soon after. Typically, this pattern is made up of a large red body with no upper shadow and engulfs the entire white body of the prior session’s candle. This indicates strong selling pressure that has overwhelmed buyers’ attempts to push prices higher. After such a strong signal, traders can expect lower prices in following sessions. A confirmation of further downward price action may occur two or three days later when prices close below the low of the prior bearish session. The Bearish Engulfin

Shooting Star

Image
The Shooting Star is a bearish reversal candlestick pattern that is formed after an upward price trend. The pattern is characterized by a small body (usually green or white) near the bottom of the candle with a long upper shadow that is at least two times the length of the body. The long upper shadow indicates that the price of the security rose significantly during the time frame of the candle, but then declined to close near or below its opening price. This can be interpreted as a sign that sellers have stepped in and taken control of the market, potentially reversing the upward trend and indicating that a price decrease may be imminent. A Shooting Star is a candlestick pattern that indicates a potential reversal of the current trend. It consists of a small body with a long upper shadow, and is typically seen after an extended uptrend or rally. The Shooting Star formation occurs when the open and close are near the low of the session, while the high of the day creates an

The Morning Star

Image
The Morning Star is a three-candle bullish reversal pattern that is formed after a downward price trend. The pattern is characterized by the following: A long red candle (representing a bearish trend) A short candle with a small real body that gaps below the first candle (representing indecision or a possible trend reversal) A long green candle that closes above the midpoint of the first red candle (representing a bullish trend) The Morning Star pattern signals that a potential trend reversal from bearish to bullish is occurring. The gap between the first and second candles indicates that there is some indecision or uncertainty in the market, while the long green candle in the third period indicates that the bulls have taken control and that a price increase may be imminent. The Morning Star trading strategy is a technical analysis pattern that is used to predict the reversal of a current downtrend in the stock market. It is classified as a three-candle reversal pattern, wh

Bullish Engulfing

Image
The Bullish Engulfing pattern is a two-candle reversal pattern that signals a potential trend reversal from bearish to bullish. It is formed when a small red candle is followed by a large green candle that completely engulfs the prior red candle. The Bullish Engulfing pattern indicates that bears were in control during the first candle, but bulls took control during the second candle, driving the price up and potentially reversing the downward trend. This is seen as a bullish sign, as it suggests that buying pressure has increased and that the asset's price may continue to rise. Bullish Engulfing is a popular trading strategy that can be used to identify potential reversals in the market. It involves two candles or bars, where the first candle is smaller than the second one. The second bar completely engulfs the first one and its body is of a different color, typically this would be black for a bearish engulfing pattern and white for a bullish engulfing pattern. The lon

Hammer

Image
The Hammer is a bullish reversal candlestick pattern that is formed after a downward price trend. The pattern is characterized by a small body (usually black or red) near the top of the candle with a long lower shadow that is at least two times the length of the body. The long lower shadow indicates that the price of the security declined significantly during the time frame of the candle, but then rallied to close near or above its opening price. This can be interpreted as a sign that buyers have stepped in and taken control of the market, potentially reversing the downward trend and indicating that a price increase may be imminent. A Hammer is a type of trading strategy that involves identifying stocks that have dropped significantly in price as potential opportunities for buying. This strategy is based on the idea that stocks that have fallen sharply in value may be undervalued and thus worthy of further investigation. The Hammer strategy seeks to buy these stocks at thei

Candle Stick Patterns

Image
Course to Candle Stick Patterns Candlestick patterns are graphical representations of price movements for a specific security or currency in a financial market. They are used in technical analysis to provide insight into market sentiment and potential price trends. Each candlestick pattern consists of a body and shadows (or wicks) that represent the range between the opening and closing prices, as well as the high and low prices of a security over a specific time frame (usually one day). The body of the candlestick is colored to indicate whether the security closed higher (green or white) or lower (red or black) than its opening price. There are many different candlestick patterns, but some of the most commonly recognized ones include the following: Bullish patterns: Hammer, Bullish Engulfing, Morning Star Bearish patterns: Shooting Star, Bearish Engulfing, Evening Star Neutral patterns: Doji, Spinning Top Candlestick patterns are one of the most widely used trading strateg