Candle Stick Body
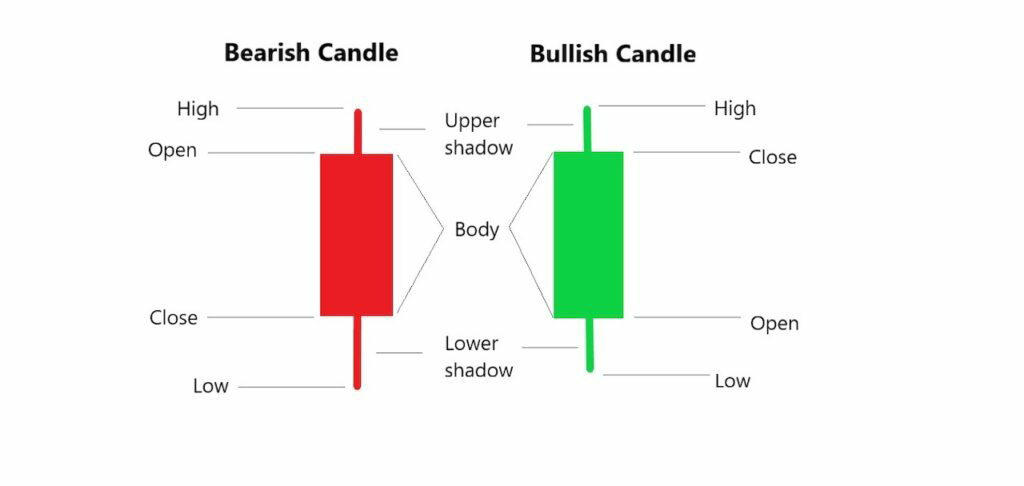
In a candlestick chart, the opening price is represented by the top or bottom of the body (rectangle or oval shape) and the closing price is represented by the opposite end. If the closing price is higher than the opening price, the body is typically depicted as hollow (white or green), indicating a bullish trend, or an upward price movement. If the closing price is lower than the opening price, the body is typically depicted as filled (black or red), indicating a bearish trend, or a downward price movement. The difference between the opening and closing price is shown by the height of the body, with longer bodies indicating greater price movement and greater market sentiment.
Candle Stick Bodies are the core element of a chart in technical analysis. They are used to analyze price action and depict the difference between the opening and closing pricess for a given period of time. Candlestick bodies represent the difference between buyers and sellers, and often tell traders whether or not a stock is trending up or down. Generally speaking, candlestick bodies tend to be one of three shapes: long, short, or doji. Long candle stick bodies indicate strong buying pressure from buyers, while short candle stick bodies signify strong selling pressure from sellers. Doji candles show that neither buyers nor sellers have been able to gain control of the stock's price during that specific period.
Not only can candle stick bodies provide insight into current price movements but they can also help traders anticipate future price movements. By studying various patterns that form on a chart, traders can use candlestick body positioning to identify potential reversal signals as well as continuation signals which could lead them to profitable trades. For example, if there is an uptrending candle stick body followed by another one with higher highs and higher lows then this might suggest that the trend is still strong and continuing upwards; while if there is an downtrending candle followed by a doji then this might suggest that the trend may have reversed itself and may now be headed back up again.
https://vm.tiktok.com/ZMYYXHhbt/


Comments
Post a Comment